How to Add a Total Row in Excel
When using Excel tables, you sometimes need to calculate the summarized data of all its rows and columns. Whether you need the average, the total sum, the smallest and largest value in the column or something else, you can use the Excel total row to calculate all of those things in just a few seconds. Why bother calculating them one by one when you can take the shortcut? In today’s tutorial, I will show you how to add a total row in Excel, but first off
Wait, what is an Excel Table?
Tables in Excel are a great way to visualize all your data. Putting all the important statistics and values in a tidy, pretty table can help make it easy to read and work with. Plus it is much more manageable than trying to figure out some unstructured data spread across the sheet. Now, you might be asking yourself how to create those Excel tables.
How to convert your data into an Excel Table
First off, let’s start with a dataset similar to this one. Make sure each value is in its respective column and row.

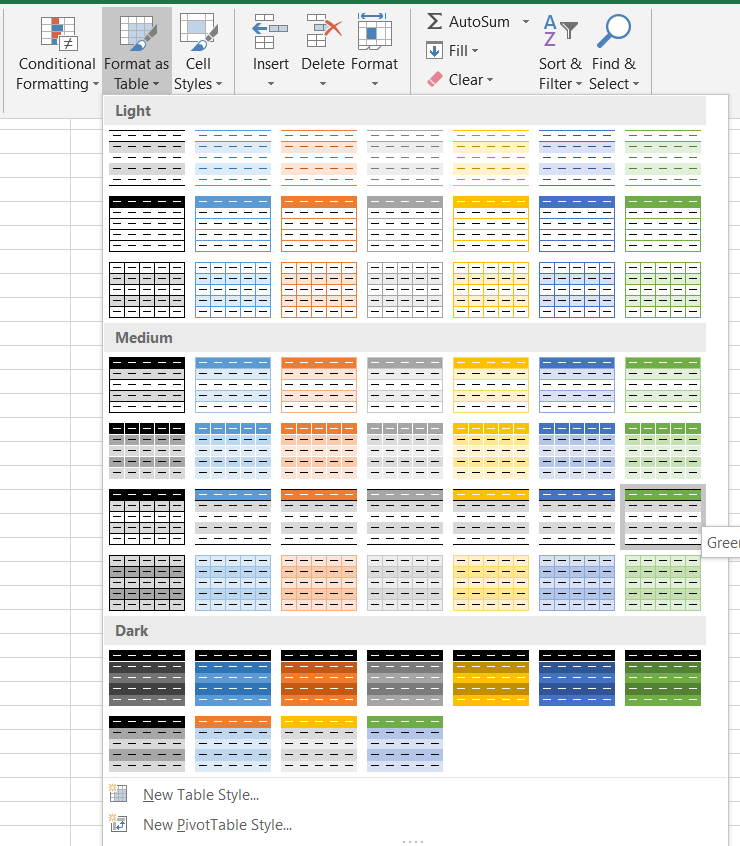
Select the cells you want to format as a table and go to the Home tab. There, from the Styles tab, click the Format as Table button.

From the drop-down menu, select the design you think most fits your table.
Confirm that you’ve selected the correct cells, and your data will be formatted in a table.

Add a Total Row Using Table Design
Now that you have your table, you may be starting to wonder how to show that total row we talked about earlier. To start, select your whole table.

Right-click the excel table and go to the Table drop-down menu. From there, you can click the Excel total row button and a new row will appear underneath your table.
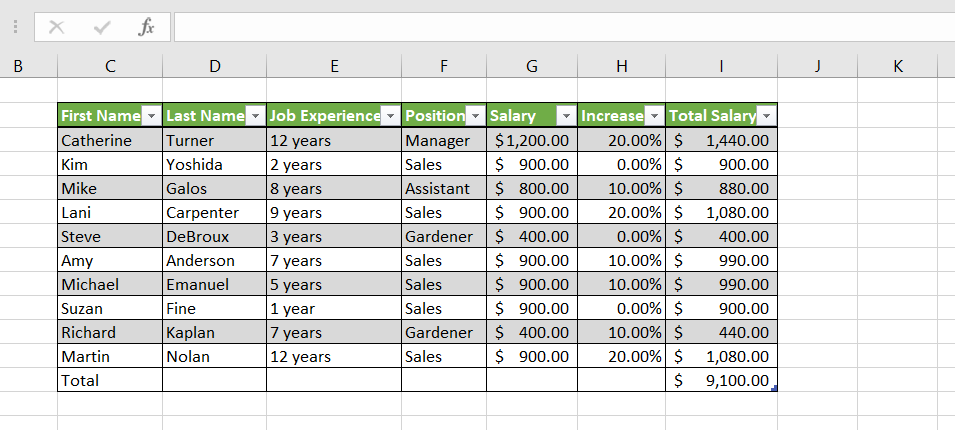
Without additional settings, it will automatically calculate the total sum of the salaries in my table. To make it calculate something else, select the cell you want to work in and click on the arrow that appears next to it.
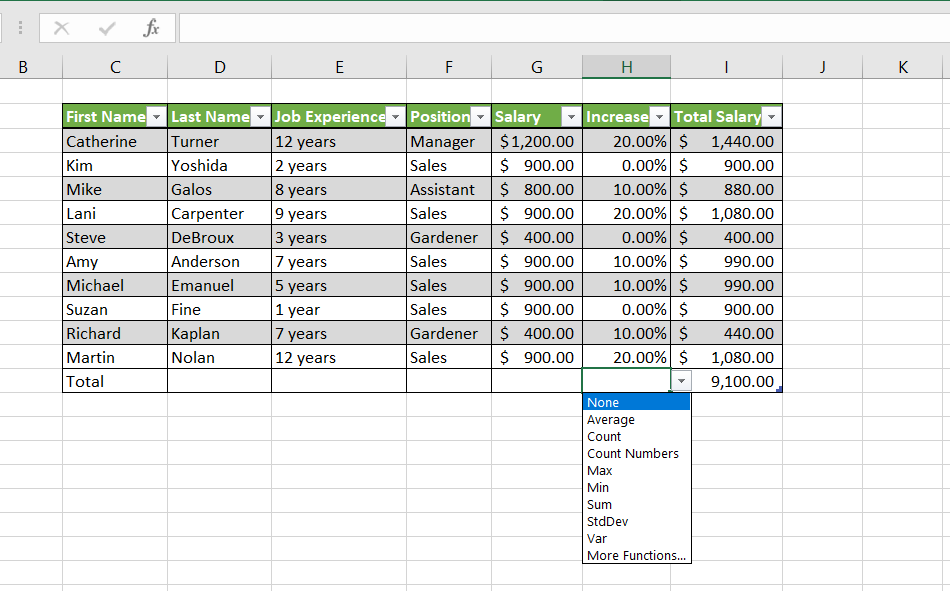
You can select what you want the Totals row to calculate in your table from the dropdown menu. I will use the Average on the Salary increase column to find the average percentage raise, the Min on the Salary one, to see who receives the least in my company, and the Max on the Job experience, to find out who my most loyal employees are (Note that you have to remove the years in the Job Experience otherwise Excel will treat it as a string and won’t be able to calculate which value is the largest).
The completed table should look something like this.
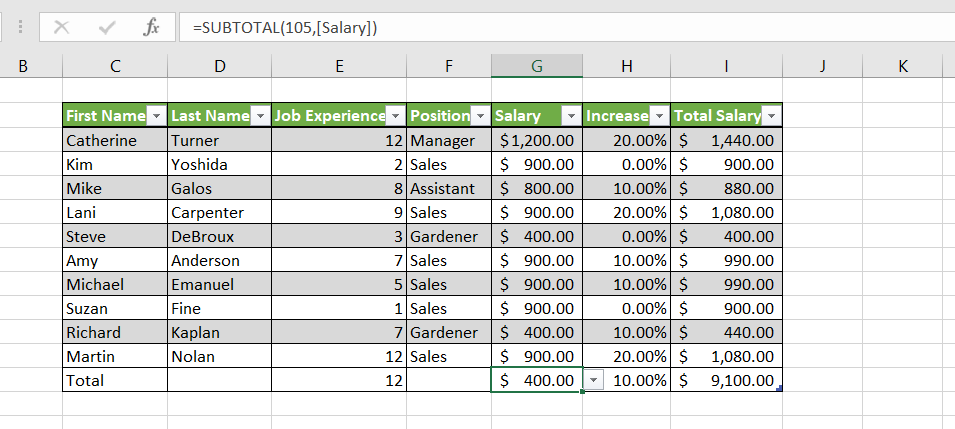
Note, that in the Formula bar we now have the =SUBOTAL formula, instead of the expected AVERAGE, SUM, MIN, MAX etc. Excel uses the SUBTOTAL formula to make those calculations with just one formula, and it even ignores a row if you hide it, as opposed to the other ones that calculate even the hidden rows. The SUBTOTAL formula is also really helpful because you can change what calculation you want it to perform in just two clicks.
Add a Total Row Using a Keyboard Shortcut
After doing this a few times, you might want to speed up the process. The keyboard shortcut for that is Ctrl+Shift+T and I will also show you the codes for the different functions in the formula. When typing in the SUBTOTAL, the first argument you have for that formula is the code for the function you use. The codes as follows are:
101 – AVERAGE – Calculates the average value of the rows from that column
102 – COUNT – Counts all the cells with a number or a date
103 – COUNTA – Stands for count all; Counts all the cells that are not blank
104 – MAX – Finds the largest values from that column
105 – MIN – Finds the lowest value from that column
106 – PRODUCT – Multiplies all the values from that column
107 – STDEV – Calculates the standard deviation
108 – STDEVP – Calculates the standard deviation for the whole population
109 – SUM – Calculates the total sum of that column
110 – VAR – Estimates the variance of a sample of data
111 – VARP – Calculates the variance of an entire population of data
How to Insert a Total Row in Excel by Adding a Row and Formula
The easiest way how to insert a total row in excel is actually by manually adding it and using a formula. To do that, after formatting your cells as a table, you can then expand the table by a row down. In that row, you can use any of the above formulas to find the sum, average, count, min and max, and so on, just by using their respective formulas. It is way quicker than formatting the whole formula and then using the Total Row and all its respective functions and arguments for the SUBTOTAL function.
Conclusion:
The Excel Total Row is an extremely useful and easy to use function in Excel, that can save you a lot of hassle instead of manually inserting the formula in each column, you can do so in a click of a button. It has a great amount of formulas built within it, which are easily added by using the dropdown menu. Nevertheless, most people find that typing the formulas by hand is a quicker and more reliable way than using the Total Row functions.