How to Calculate Cumulative Percentage in Excel: A Clear Guide
Calculating cumulative percentage is a common task in data analysis and reporting. It is a way to represent how much of a total value is made up by each individual value in a dataset. Excel provides several functions that can be used to calculate cumulative percentage, making it easy for users to perform this task without having to manually calculate each value.
One of the most commonly used functions for calculating cumulative percentage in Excel is the SUM function. Another function that can be used is the CUMIPMT function, which calculates the cumulative interest paid on a loan over a specific period of time.
In addition to these built-in functions, Excel also provides several tools that can be used to create charts and graphs that display cumulative percentage data. These tools can be used to create visual representations of the data, making it easier to understand and analyze. Overall, Excel provides a wide range of tools and functions that can be used to calculate and display cumulative percentage data, making it an essential tool for data analysis and reporting.
What Is Cumulative Percentage and What Is It Used For?
Cumulative percentage is a measure of the percentage of data that falls below a certain value in a dataset. It is calculated by adding up the frequencies or percentages of the values up to a certain point.
In Excel, cumulative percentage can be calculated using the SUM and SUMIF functions. This measure is commonly used in statistical analysis, finance, and business to understand the distribution of data and to make informed decisions based on that data.
For example, in finance, cumulative percentage can be used to analyze the performance of an investment portfolio. By calculating the cumulative percentage of returns over a period of time, investors can determine the overall growth of their portfolio and make decisions about future investments.
In addition, cumulative percentage can be used in marketing to analyze customer behavior. For instance, by calculating the cumulative percentage of customers who make repeat purchases, businesses can determine the effectiveness of their customer retention strategies and make adjustments as necessary.
Overall, cumulative percentage is a useful tool for understanding the distribution of data and making informed decisions based on that data.
How to Calculate Cumulative Percentage
Calculating cumulative percentage in Excel is a useful technique for analyzing data. It allows you to determine how much of a total percentage a data point or group of data points represents. Here are the steps to follow to calculate cumulative percentage in Excel.
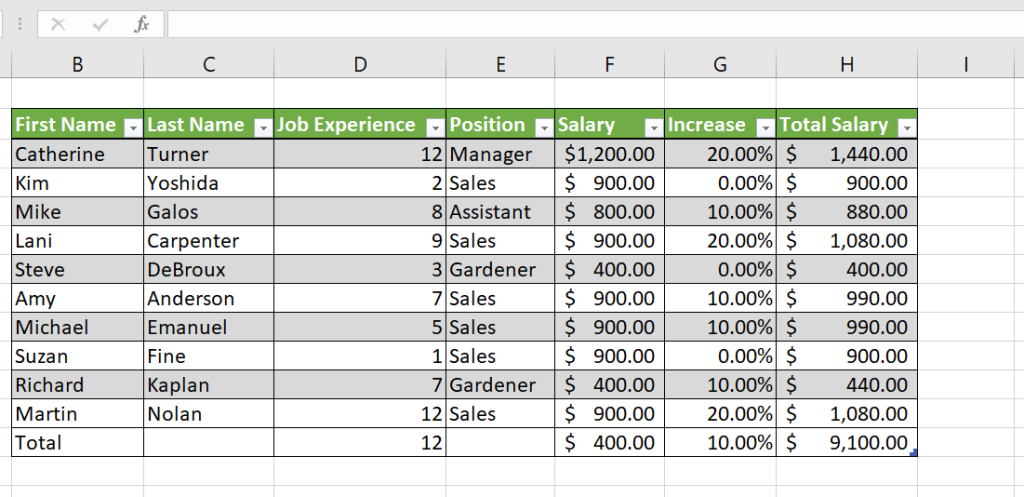
Step 1: Enter the Data
The first step is to enter your data into an Excel spreadsheet. Make sure that each data point is in a separate cell and that the data is organized in columns or rows. For example, if you are analyzing sales data, you may have a column for the sales amount and a column for the product name.
Step 2: Calculate Cumulative Frequency
The next step is to calculate the cumulative frequency of the data. Cumulative frequency is the total number of data points up to a certain point in your data set. To calculate cumulative frequency, you can use the following formula:
=SUM(cells_range)
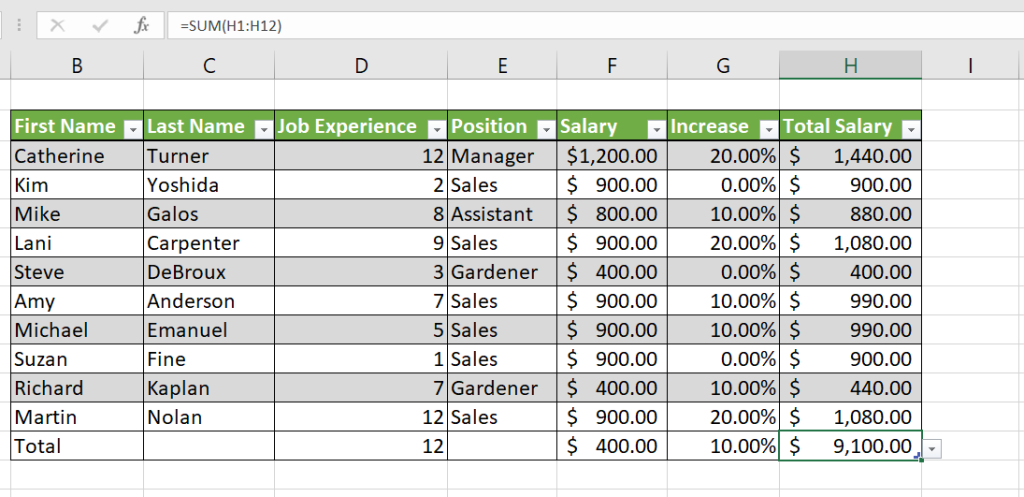
This formula adds up all of the values in the range from the second cell in column B to the current cell in column B. You can then drag the formula down to calculate the cumulative frequency for each data point.
Step 3: Calculate Cumulative Percentage
Finally, you can calculate the cumulative percentage by dividing the cumulative frequency by the total sum. You can use the following:
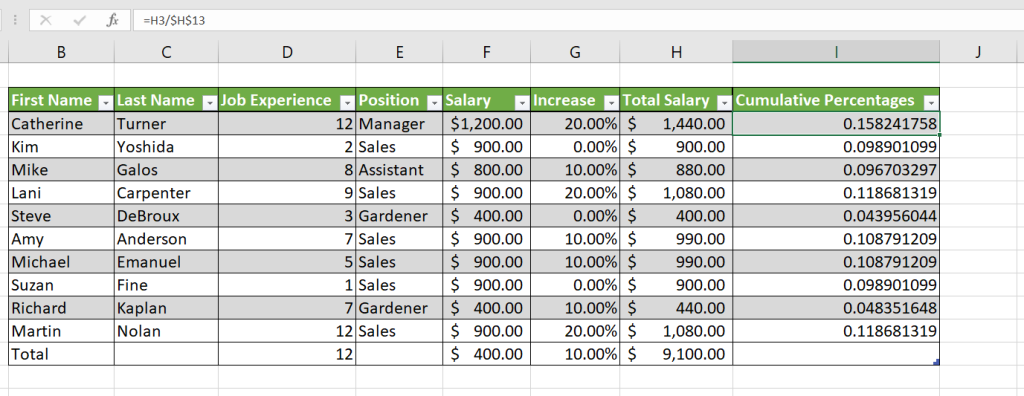
You can then drag the formula down to calculate the cumulative percentage for each data point.
To get it formatted as a percentage, we can go to General -> Number and then click on the Percentage symbol (%).
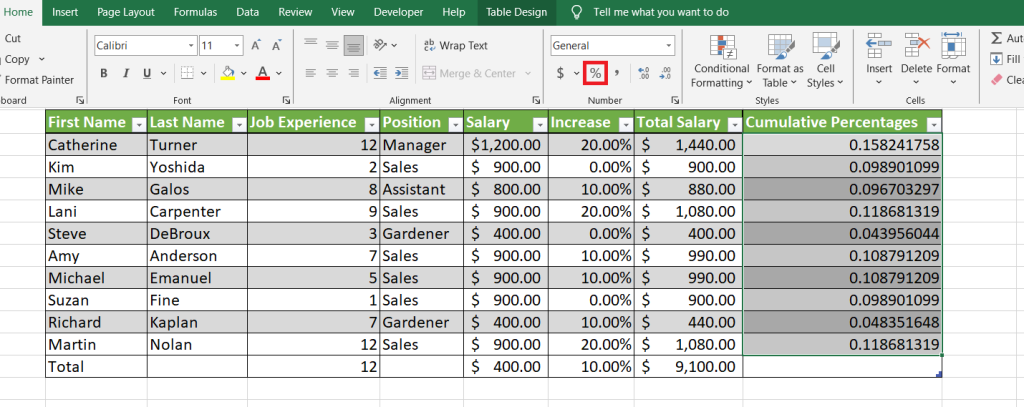
Now you will have the percentages as whole values. If you need more precision, you can use these two buttons to increase and decrease the number of digits after the decimal point.

The end result is easily readable and much simpler to navigate. Making conclusions from data is very straightforward with a cumulative percentage shown next to it to put some perspective on it.

Using Manual Computation to Calculate Cumulative Percentage in Excel
If you prefer not to do the calculations in steps, you can combine them in one simple formula, as shown below:

To calculate the cumulative percentage for each row, the user needs to divide the cumulative total for that row by the total of all values in the column. This can be done using the formula:
=value/SUM(cell_range)
The resulting value is the cumulative percentage for that row.
Using a Formula to Compute Cumulative Percentage in Excel
To calculate cumulative percentage in Excel, one can use a formula that involves the SUM and SUMIF functions. This formula is useful for tracking the progress of a project or analyzing data over time.
First, create a table with the data you want to analyze. In this example, let’s say you have a table with three columns: Month, Sales, and Cumulative Percentage.
Next, add a formula to the Cumulative Percentage column. The formula should use the SUM function to add up the Sales column up to the current row, and then divide that sum by the total sales for all months. Here’s an example formula:
=SUM(B$2:B2)/SUM(B$2:B$13)
In this formula, B$2 is the range of cells from the second row to the current row in the Sales column, and B$2$13 is the total range of cells in the Sales column.
Once you enter this formula in the first cell of the Cumulative Percentage column, you can copy and paste it down to the rest of the rows. Excel will automatically adjust the cell references to the correct rows.
With this formula, you can easily calculate the cumulative percentage for any data set in Excel.
Using a Pivot Table to Compute the Cumulative Percentage in Excel
Pivot tables are a powerful tool in Excel that can be used to summarize and analyze large amounts of data quickly and easily. One useful application of pivot tables is to compute the cumulative percentage of data.
To use a pivot table to compute the cumulative percentage, first, select the data that you want to analyze. Then, insert a pivot table by going to the “Insert” tab and selecting “Pivot Table.”
Next, drag the column that you want to analyze to the “Values” area of the pivot table. Then, drag the same column to the “Rows” area of the pivot table.
Once you have done this, right-click on one of the values in the pivot table and select “Show Values As,” then “% Running Total In.” This will display the cumulative percentage for each value in the selected column.
Using a pivot table to compute the cumulative percentage in Excel is a simple and efficient way to analyze large amounts of data. It allows you to quickly see how much of the total data is represented by each individual value, making it easier to identify trends and patterns in the data.
Conclusion
In conclusion, calculating cumulative percentage in Excel can be a useful tool for analyzing data trends and identifying patterns. By using the appropriate formulas and functions, users can easily calculate cumulative percentages for a range of data points.
It is important to note that while Excel provides a powerful set of tools for data analysis, it is ultimately up to the user to ensure the accuracy and integrity of their data. Careful attention should be paid to data entry, formatting, and calculation methods to avoid errors and inconsistencies.
Additionally, users should be aware that cumulative percentages may not always provide a complete picture of a data set. Other statistical measures such as mean, median, and standard deviation may be necessary to fully understand the distribution and variability of the data.
Overall, the ability to calculate cumulative percentages in Excel is a valuable skill for anyone working with data. With the right tools and techniques, users can gain valuable insights into their data and make more informed decisions.